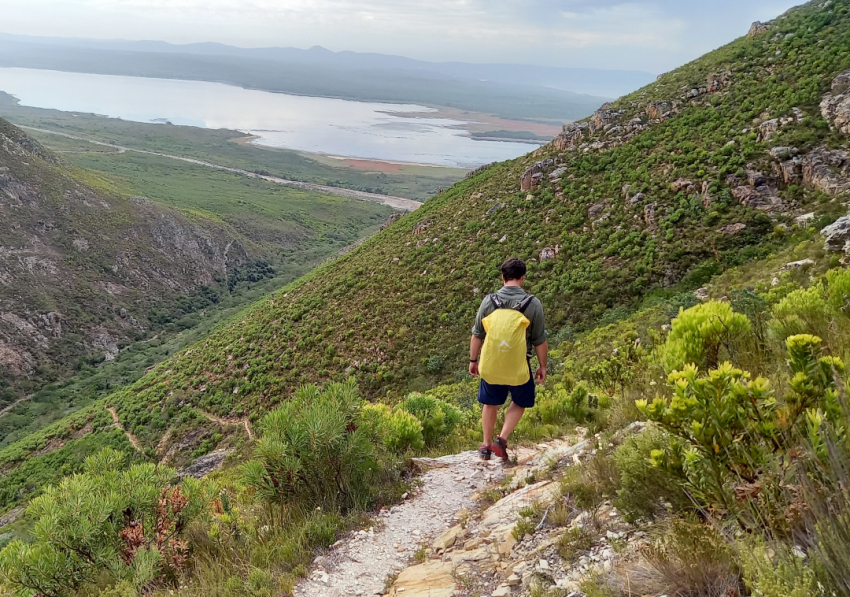
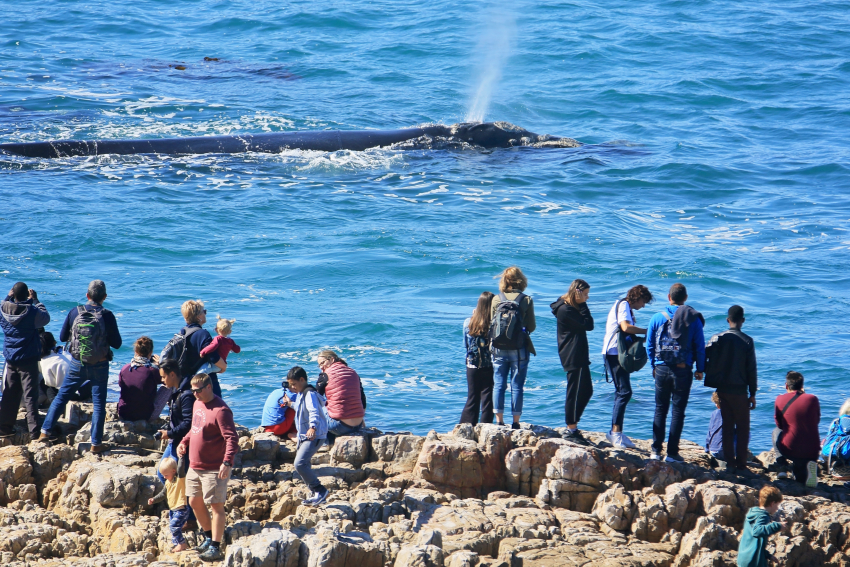
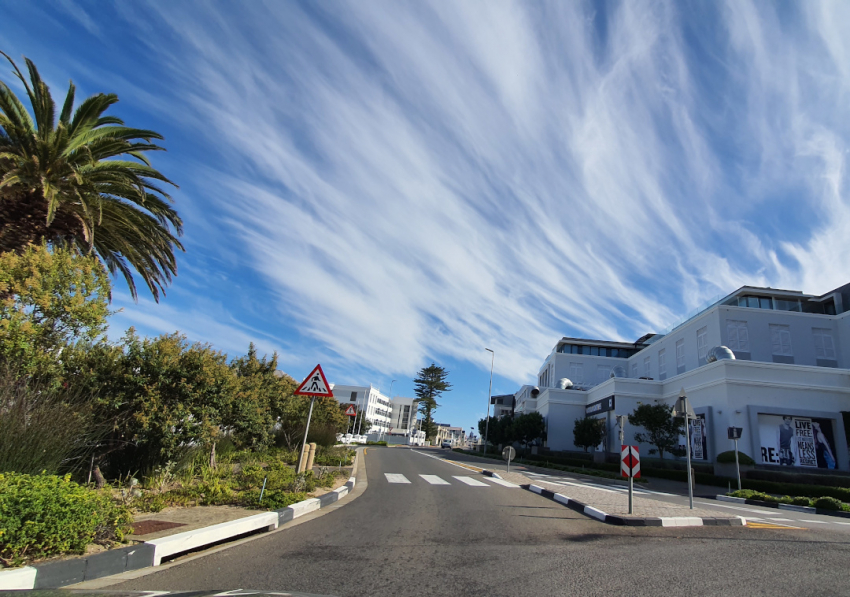
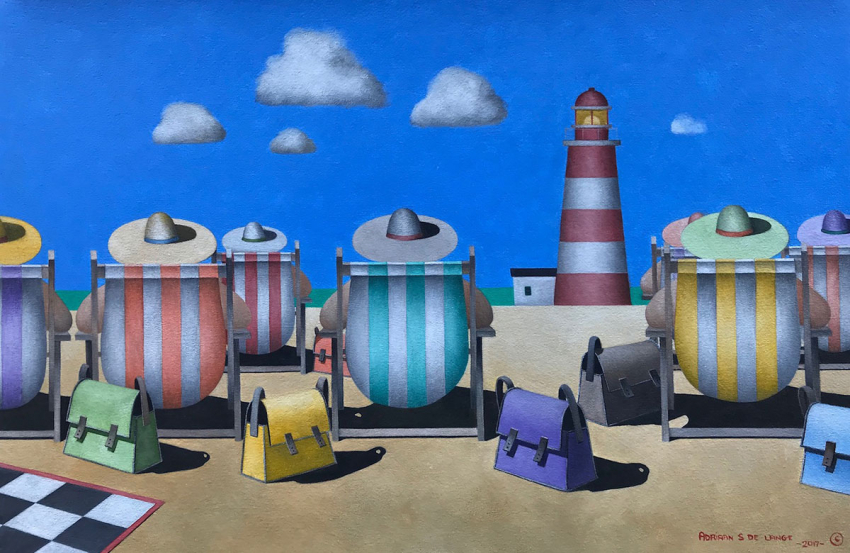
Hermanus has always been a small community in which many different cultures, beliefs and systems coincide and thrive. It is because of this vast variety of ages, cultures etc. that make Hermanus a kaleidoscope of experiences for the visitor and locals alike.
The following graphs show the wards 3 through 8, 12 and 13; all of which are part of the Hermanus Focus Area. Each sector is allocated a ward number, which is used to identify them (mainly for municipal use). The selected wards and their corresponding sectors for this demographic are as follows:
- Ward 3 – Hermanus
- Ward 4 – Westcliff, Mount Pleasant & Hemel en Aarde Valley
- Ward 5 – Zwelihle South
- Ward 6 – Zwelihle North
- Ward 7 – Sandbaai
- Ward 8 – Hawston, Fisherhaven & Honingklip
- Ward 12 – Zwelihle North-West
- Ward 13 – Onrus & Vermont
Please click the desired image for a full page view
 |
Age & Gender
The Age & Gender graph shows the different age sectors and the percentage of the population that they make up within their different wards. The gender percentages can be found at the top of each “body”, whilst the ages on either side are based on the female and male population amounts (left = female and right = male representation).
|
 |
Employment
The employment rates within the different wards shows a similar percentage for each sector throughout the demographic interpretation. The information is not gender or age based, but rather based on the entirety of the population.
The “Not Applicable” sector is designed to encompass the underage and unavailable numbers of the population, as well as those who do not wish to disclose their employment status.
|
 |
Language
As with the Employment Demographic, the Language Demographic does is not based on age or gender. However, it is also not ward based and shows the language usage throughout the chosen wards (wards 3 to 8, 12 and 13). The “Other” option encompasses several of the less used languages as well as the excess of the population that did not wish to divulge their language usage.
|
 |
Race
The Race Demographic shows the percentage of the entire population that falls within the different sectors, namely Black African, Mixed Race, Indian/Asian, Caucasian and Other. The smaller amounts beneath the percentages shows the actual tallied amount of people of that race.
The “Other” graph is in place for those not wishing to divulge their race.
|
 |
Population
The Population Demographic is based on each ward. The colour code to the right of the image indicates the different wards whilst the map displays the wards as they would be found on the map.
|